Integrate with Prometheus
Overview of all Prometheus metrics that KEDA provides
Prometheus Exporter Metrics
Operator
The KEDA Operator exposes Prometheus metrics which can be scraped on port 8080 at /metrics. The following metrics are being gathered:
keda_build_info- Info metric, with static information about KEDA build like: version, git commit and Golang runtime info.keda_scaler_active- This metric marks whether the particular scaler is active (value == 1) or in-active (value == 0).keda_scaler_metrics_value- The current value for each scaler’s metric that would be used by the HPA in computing the target average.keda_scaler_metrics_latency- The latency of retrieving current metric from each scaler.keda_scaler_errors- The number of errors that have occurred for each scaler.keda_scaler_errors_total- The total number of errors encountered for all scalers.keda_scaled_object_errors- The number of errors that have occurred for each ScaledObject.keda_resource_totals- Total number of KEDA custom resources per namespace for each custom resource type (CRD).keda_trigger_totals- Total number of triggers per trigger type.- Metrics exposed by the
Operator SDKframework as explained here.
Admission Webhooks
The KEDA Webhooks expose Prometheus metrics which can be scraped on port 8080 at /metrics. The following metrics are being gathered:
keda_webhook_scaled_object_validation_total- The current value for scaled object validations.keda_webhook_scaled_object_validation_errors- The number of validation errors.
Metrics Server
The KEDA Metrics Adapter exposes Prometheus metrics which can be scraped on port 8080 at /metrics. The following metrics are being gathered:
- Metrics exposed by the
Operator SDKframework as explained here.
Premade Grafana dashboard
A premade Grafana dashboard is available to visualize metrics exposed by the KEDA Metrics Adapter.
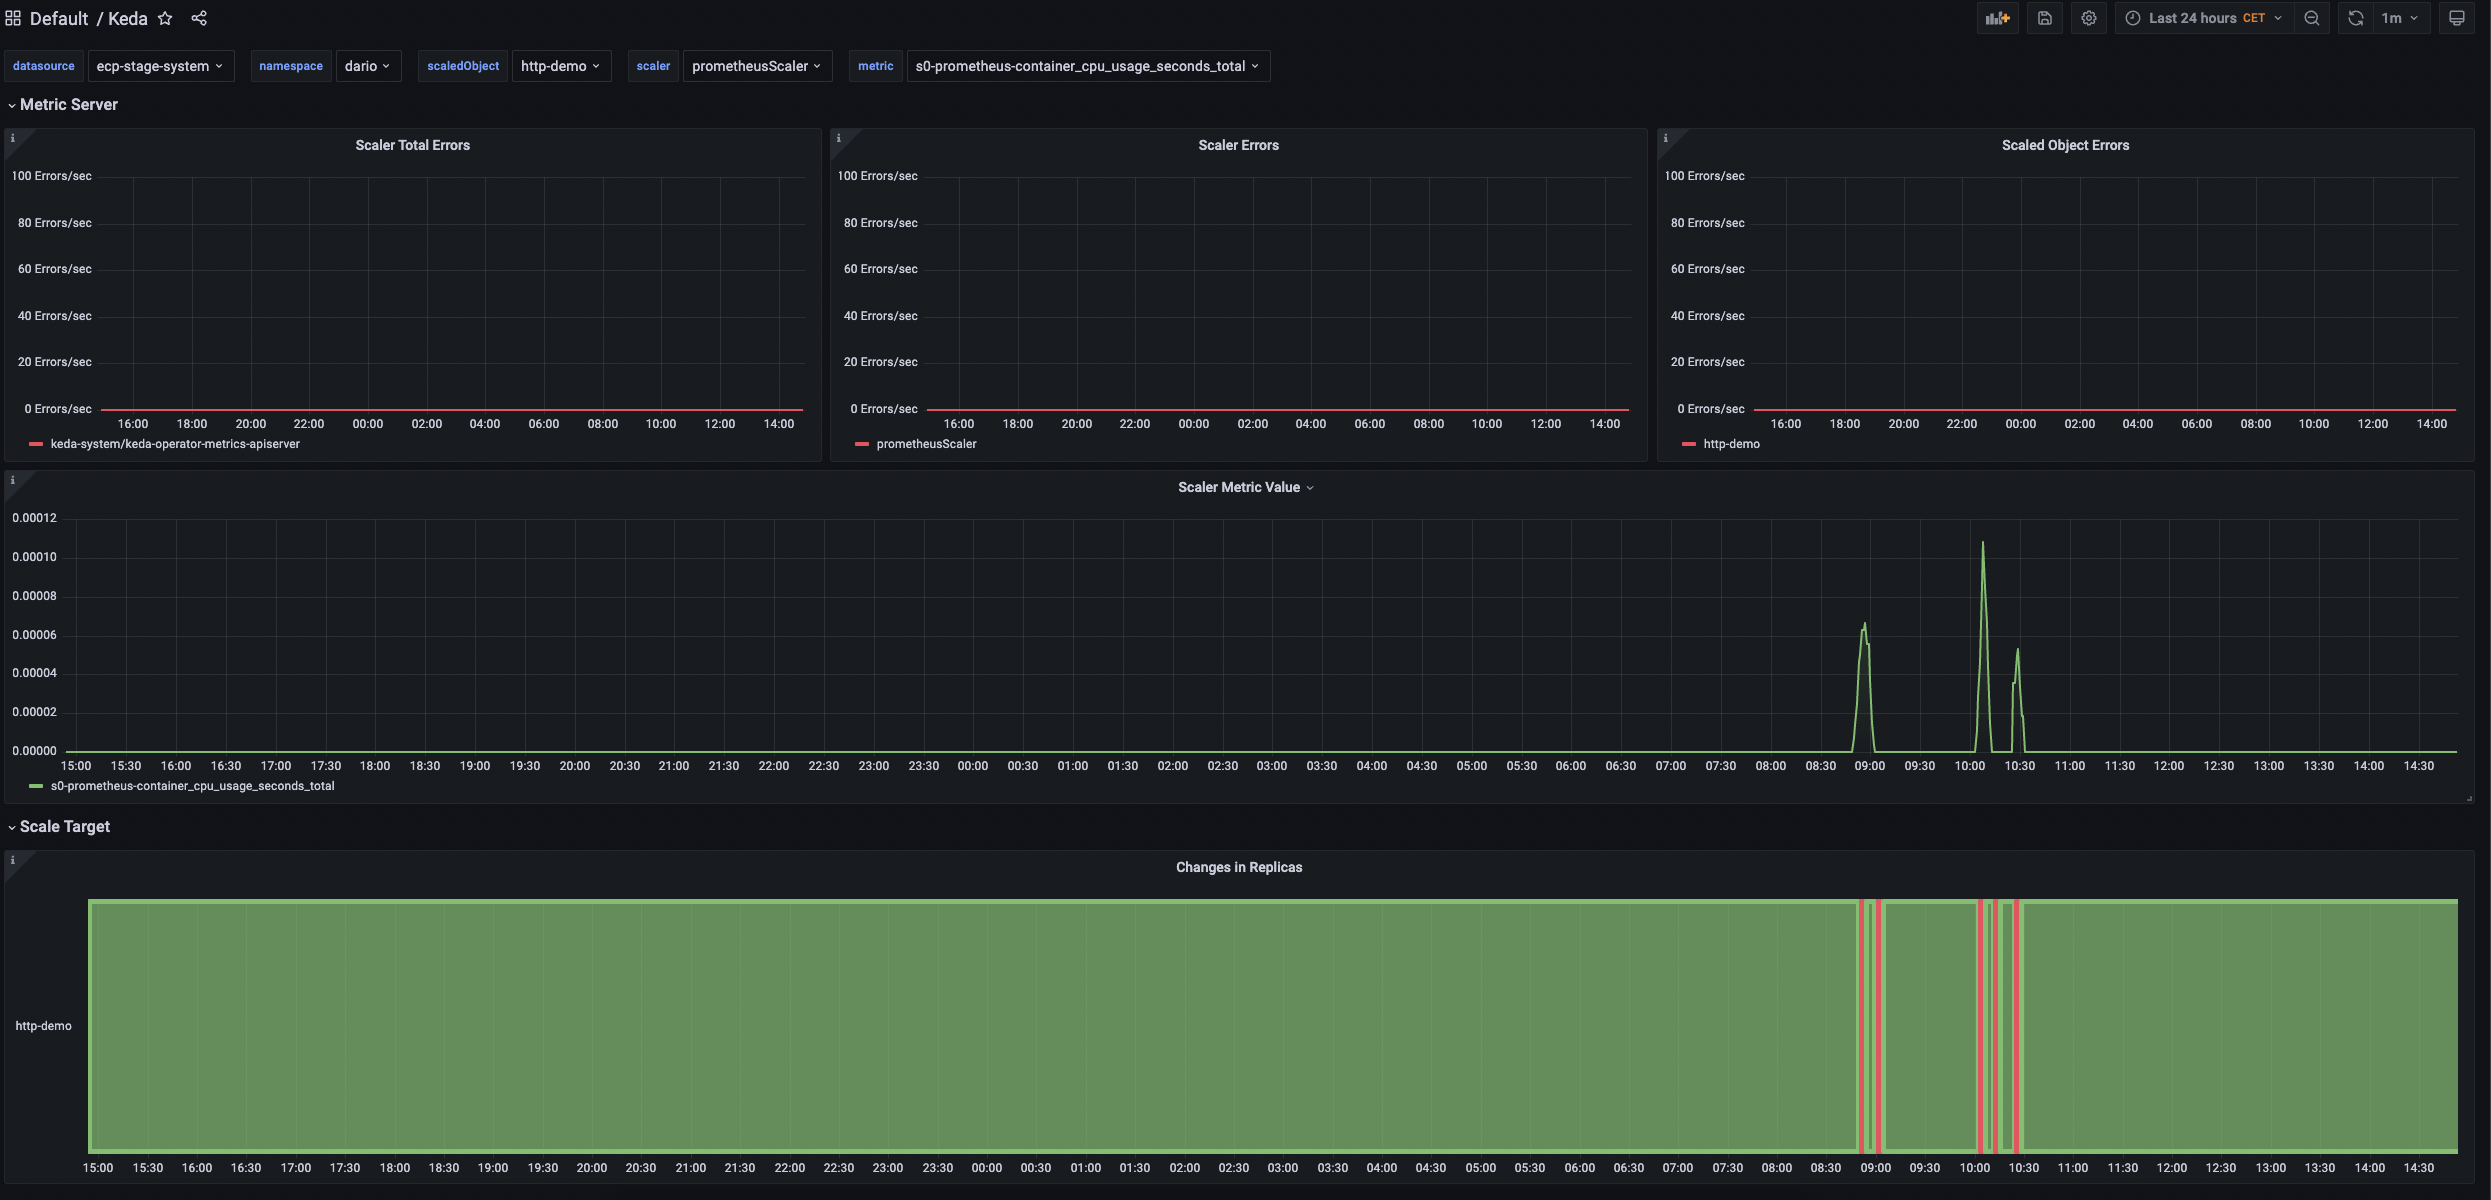
The dashboard has two sections:
- Visualization of KEDA’s metric server
- Visualization of the scale target and its changes in replicas scaled by KEDA
On top, the dashboard supports the following variables:
- datasource
- namespace
- scaledObject
- scaler
- metric